A few useful tools for graduate students
I wanted to share some tools that would be helpful to students doing biomedical research. Some of these come from classes I took for Management of Drug Development (MDD) regulatory science master’s degree, but they generally apply to science. You can find way more detailed information and elaborate templates on the internet, but feel free to use these as starting points! Also, check out my methods page for cool/free bioinformatics tools and business resources I’ve found.
Gantt charts
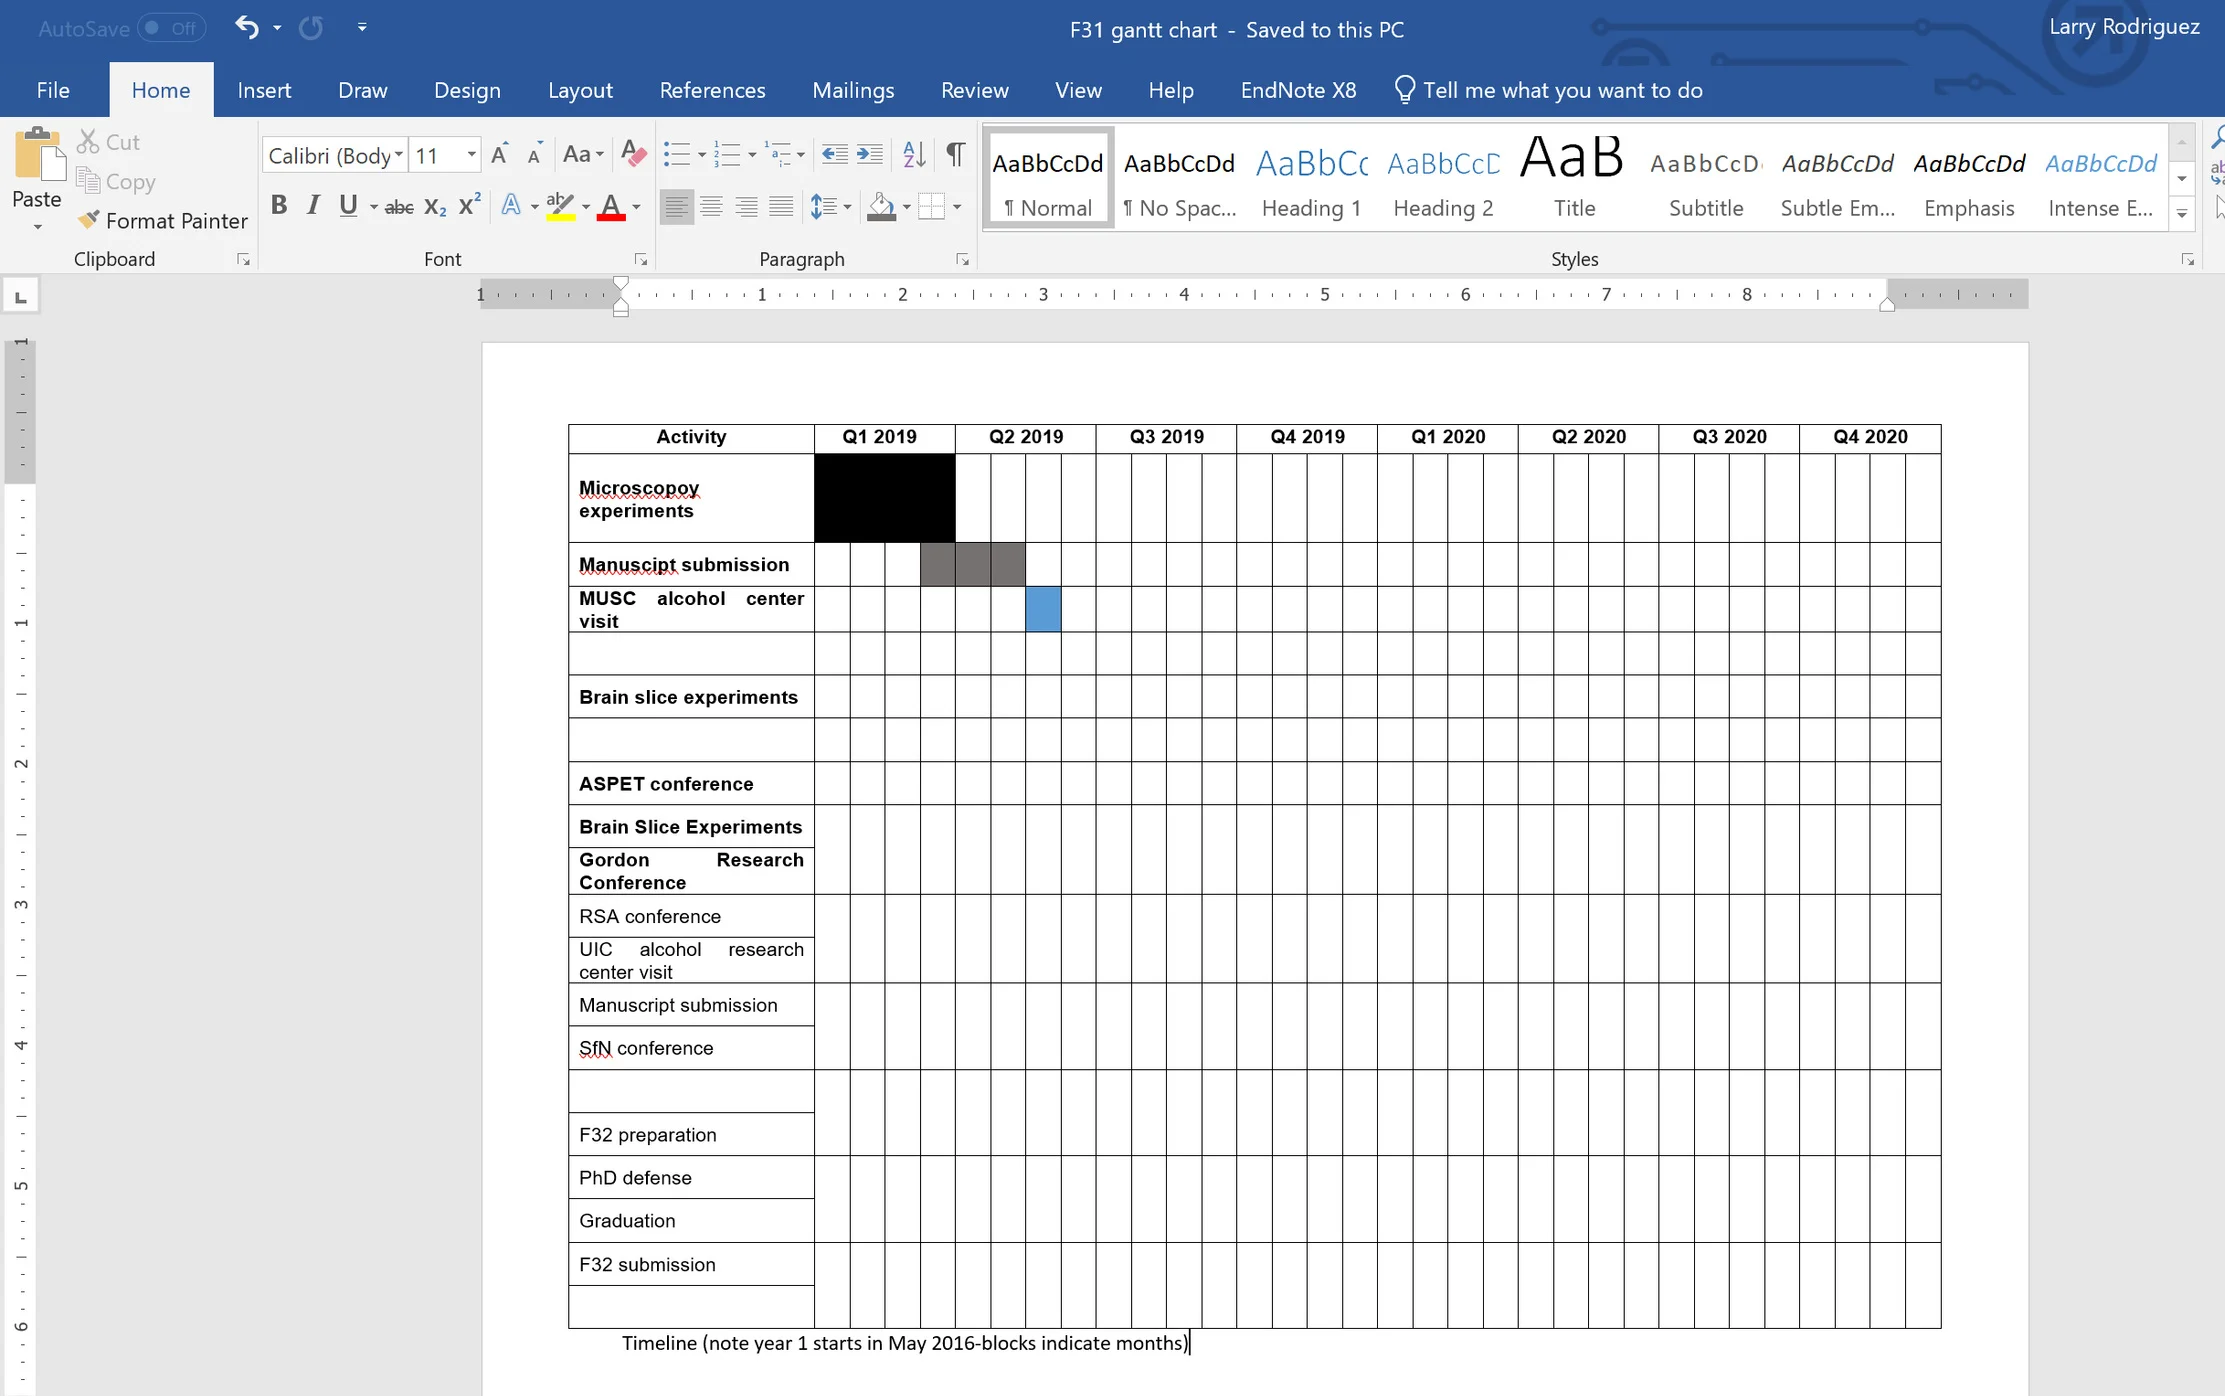
A Gantt chart is basically a timeline in bar format. This helps you visualize the various moving parts of a project: when one activity starts, when you plan to start another activity, and when you expect to move on to the next step. I try to make a Gantt chart once every semester to update my goals and to stay on top of research progress. For students submitting an F31 to the NIH, this a great tool to show reviewers that you’ve seriously thought about what you need to accomplish and that you have a plan in place. I uploaded one of my early attempts here, although credit for this design (simple but elegant) goes to Dr. John Woodward, who has helped me with the grant submission process. A Gantt chart also forces you to stop and think about all the things you need to accomplish, e.g. can you really learn a new technique, collect data, and prepare a manuscript in the last 4 weeks of December?
An early draft of the Gantt chart I submitted with my F31. Just fill in the columns to show when you plan on finishing a project/task.
Cause and effect Diagrams (aka Fishbone or Ishikawa diagram)
A good cause and effect diagram is invaluable when you’re troubleshooting experiments in lab. I took a regulatory science course called Quality Assurance for Drugs and Biologics, and when it comes to drugs, we learned that its not enough to stop a problem from happening, you have to do a root cause analysis: figure out why it occurred, how you can detect it earlier, and have a Corrective Action, Preventive Action (CAPA) plan for preventing and fixing the issue. The diagram takes the common things that can go wrong (ideally based on past experience) so that you don’t go chasing every random thing that cause a problem. Here, I’ve uploaded a template for troubleshooting from the American Society for Quality (ASQ) written for an electrophysiology experiment, but it could easily be written for a PCR experiment, a western blot, etc. In science, we don’t usually have time or knowledge to make these tools, we usually just rely on experience: doing X fixed the experiment before. With a cause and effect diagram, you can look at the common causes of failure and start narrowing down the problem. It’s also a useful tool for learning! If you use a reaction kit, mixing X, Y, and Z in a test tube should give you a product, but what if you don’t have experience working with those chemicals? Where should you start? That’s when things like laboratory protocols and standard operating procedures (SOPs) become important. Again, I made very simple cause and effect diagram for a common problem my students have during an electrophysiology experiment: being unable to offset our recording electrodes. I can identify the problem in seconds, but for students who are new, figure out what went wrong could to 20+ minutes. It didn’t even take me 20 minutes to make the diagram, and now students will be better prepared to solve the problem.
Simple example for just one thing that can go wrong during an experiment. Still, it’s a great way to get organized and think through a problem.
PubMed email alerts
If you haven’t already, sign up for PubMed email alerts! Its tough to stay up to date with scientific literature, but you don’t have to rely on periodic random searches. I’ve set up email notifications for topics related to my research (NMDA receptors, P2X4 receptors, alcohol addiction, etc) so that I get an email each day with recent publications, which include the abstract. You don’t have to read every single paper; read the abstract, and if it sounds like its related to your work, read the full paper. This way, you at least get a general idea of what people are doing, even if it’s not what you’re doing.
SCIENTISTS NEED TO BE ON TWITTER! I follow a lot of scientists on twitter and have learned a lot about neuroscience and science in general just by following them. People openly share their experience in science and grant writing, so to me, its crazy not to have a twitter. You can keep it strictly professional if you’d prefer (I don’t) but to me, Pubmed email alerts and Twitter are where I get the majority of my science news. The value of being able to engage the public should not be understated either! Most of the biomedical research in the united states is funded by taxpayers, who are on twitter. You don’t have to walk up to people on the street and give them a mini-seminar on your research in order to do science outreach, just post about what you’re doing and why, so that people can find you. Growing up, I didn’t know any scientists, but I knew I wanted to be one. Even after starting college, I struggled to find people at my university working in the field I was interested in. Science is way bigger than the research going on at one University, and more scientists are on twitter than those who attend even the largest scientific conference.
Professional and serious twitter example. Not really but sometimes.


